Visual Studio interface
At first the Visual Studio interface can be a bit overwhelming but rest assured, its actually quite easy. Let’s have a look.
Panels you’ll need
In the menu you’ll find the View button, there you’ll find all the panels you’ll need. The ones you definitely want are Toolbox, Solution Explorer, Outpt and Error List.
You can drag the panels around by holding down the top (where their name is), you’ll see you can also snap them to the sides or to other panels.
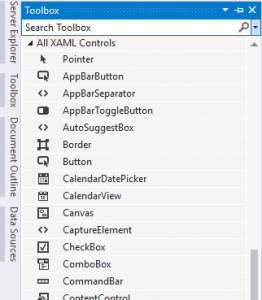
The Toolbox contains a list of all controls you can use.
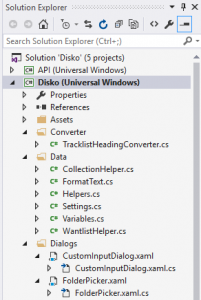
The Solution Explorer contains a list of all projects and its files. A collection of projects is called a solution.
Next to some files there’s an arrow. This mean you can expand this file to show its code file.
.xaml files are the interfaces containing the layout code, while .xaml.cs are the code-behind files of the interfaces.
You can also create folders or new files by right-clicking in the solution explorer at the place where you want to create a new item.
Double clicking an item will open it in the center panel.
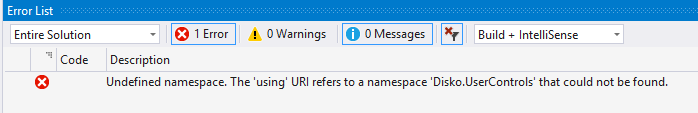
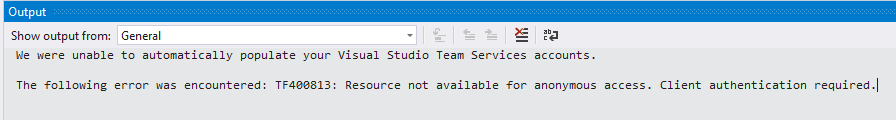
The Error List shows all info, errors and warnings about the current solution. Double clicking on an error will take you straight to it, if possible.
The Output will show all logging and debugging info. You can output your own debug info to this window in code, we’ll do this in another tutorial.
In the center of the screen you’ll see the editor, this will be either the interface editor or the code editor.
The interface editor can be split into two, so you can code while viewing the results. You can toggle this by using the – or | buttons in the middle of or below the interface editor.
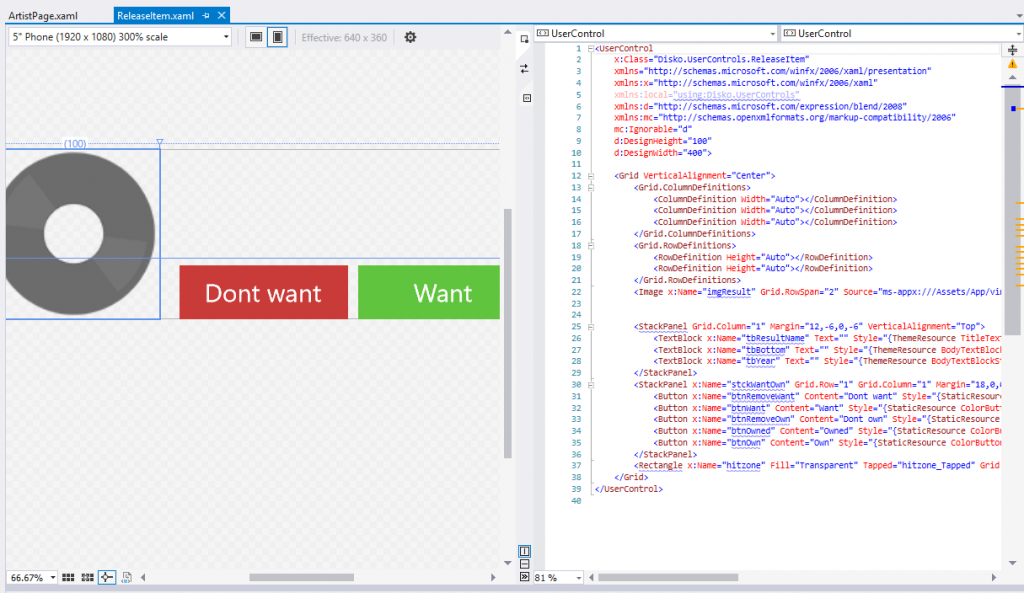
This can also be a code view.
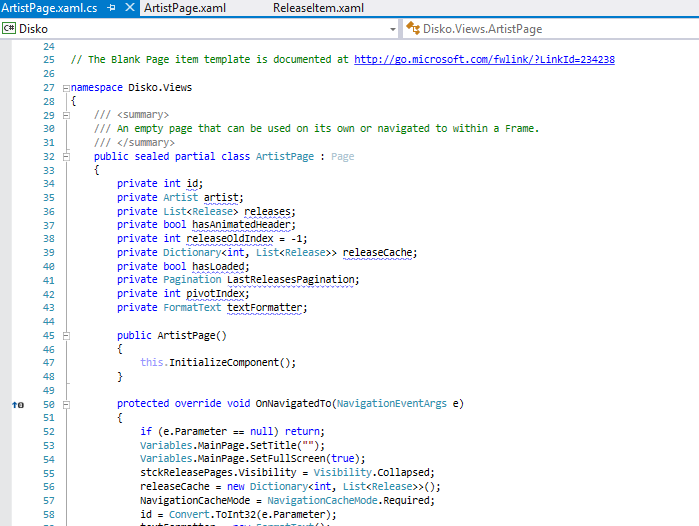
Code view
In the code view you can enable the line numbers by going to Tools > Options > Text Editor > All Languages > General > tick ‘Line numbers’.
At the top you can quickly jump to a function or variable.
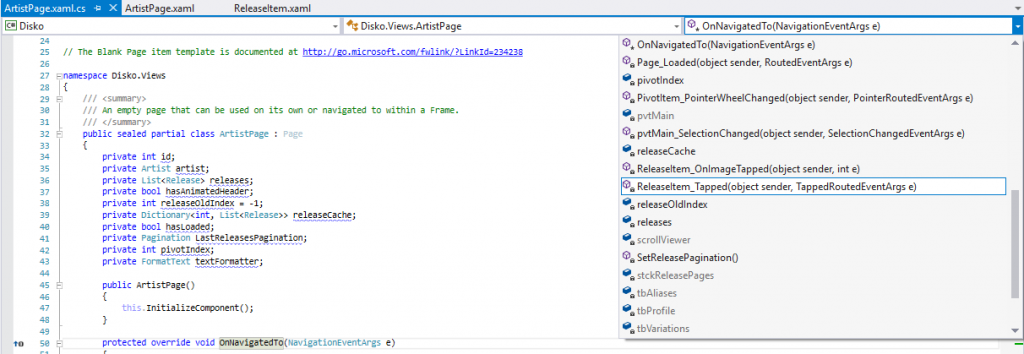
In your code, you can also hold CTRL and hover over a function, clicking it will bring you straight to it.
A handy feature is code completion, this is done by double tapping the Tab button on your keyboard. For example, if you type ‘try’ (without the quotes) and then double tap Tab it will create a try-catch block.
Top toolbar
In the top toolbar you can use the blue arrow to navigate back and forth between pages and functions.
There you will also find the undo and redo buttons (the curved arrows).
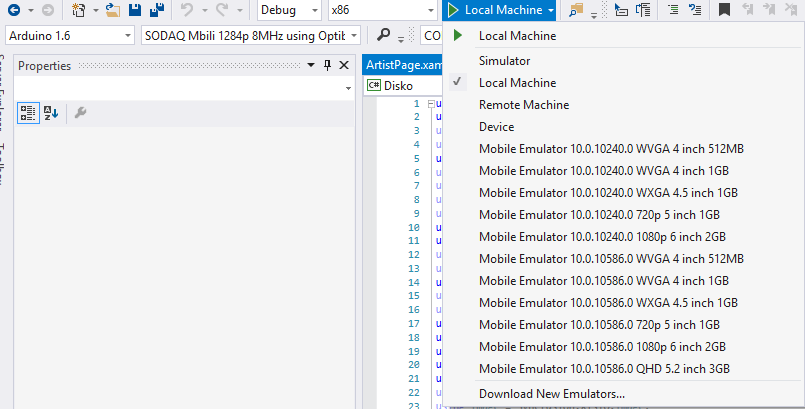
To start an app you press the green arrow. The grey arrow next to it allows you to change the emulator or device you will be running the app on.
You can also change if youre running the debug (for testing) or release (for the store) version of the app. And next to it you can change to processor type, like x86 (PC/tablet) or ARM (phones).